 Facebook
 X
X
 Pinterest
 Copy Link
2026-2027 Football Schedules, Recipes, & Tips

Football fans, preseason is coming soon! Are you ready to party like a champ? The separation is in the preparation, so scroll down for printable pro + college schedules, tailgating hacks (including how to pack the perfect cooler!), and favorite gameday recipes.
Keep everyone entertained—even during commercials—with our printable football bingo sheets. You can also find fun printables for kids at https://www.seahawks.com/junior-12s/ including a downloadable maze, I Spy game, word search, coloring pages, and more.
Need to brush up on your sports lingo? Check out Wikipedia’s handy football glossary. You’ll be able to say impressive things like, “Are they running a 3-4 defense?” and “It’s not intentional grounding outside the pocket if the ball passes the line of scrimmage.”


We earn the trust and loyalty of our brokers and clients by doing real estate exceptionally well. The leader in our market, we deliver client-focused service in an authentic, collaborative, and transparent manner and with the unmatched knowledge and expertise that comes from decades of experience.
© Copyright 2026, Windermere Real Estate/Mercer Island.
How’s the Market? Q2 2026 Review of Seattle Area Real Estate

The real estate market stayed relatively flat in the second quarter with Seattle’s year-over-year numbers holding steady and the Eastside seeing a little more of a lag. Median sales prices dipped slightly in most areas as the supply of available listings increased, but many homes still sold in the first 10 days and at or above their listed prices. The market is fairly balanced for both home buyers and sellers.
This stability feels really comforting in a market full of questions: Will my home sell? How will home shoppers respond to the price? Will they like the color of the countertops we chose? The “X Factor” for coming out on top is (and always has been) having an agent who knows the numbers…trust their spidey-senses on pricing and home prep.
For buyers, now is a prime time to dive into the market…especially if you detest the risk, bidding wars, and lack of good options we’ve seen in recent years. A word of advice to home shoppers: don’t sleep on the one that looks too good to be true. It is, and other people know it, too. Be aggressive if you want to sleep in it one day.
Click or scroll down to find your area report:
Seattle | Eastside | Mercer Island | Condos | Waterfront
SEATTLE
New listings hit a record high of 3,427 last quarter (or at least the 6 year high) up 0.4% YOY and sales tracked very closely behind, down just 0.6% from 2,027 in Q2 2025 to 2,014 in Q2 2026. Median home prices responded by ticking down the tiniest bit, 2% or $20,000, encouraging despite the loss.
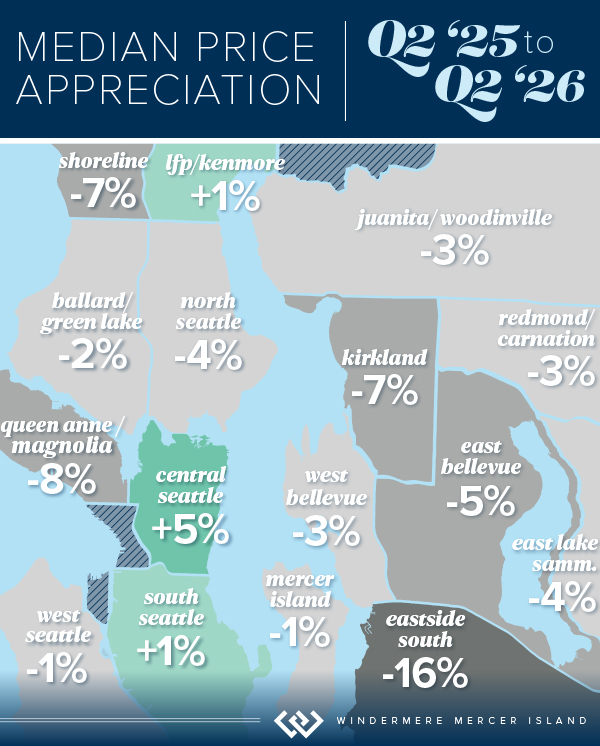
There are several bright spots on the Westside. The area South of Seattle posted a 20% gain in total sales along with a 1% rise in median price and was promptly shown up by Lake Forest Park at a 29% increase in sales also with a 1% median price lift. Capitol Hill showed the largest gain in median price at 5% (a $55,000 boost YOY). It’s nice to have a few neighborhoods to “shout out” in a YOY landscape that is relatively flat. In this case that is flat read: stable and predictable. A reprieve from the world around us.
59% of homes sold in the first 10 days and a whopping 67% of homes sold at or above list price. It’s still a good time to make a move!

Click here for the full report and neighborhood-by-neighborhood statistics!

EASTSIDE
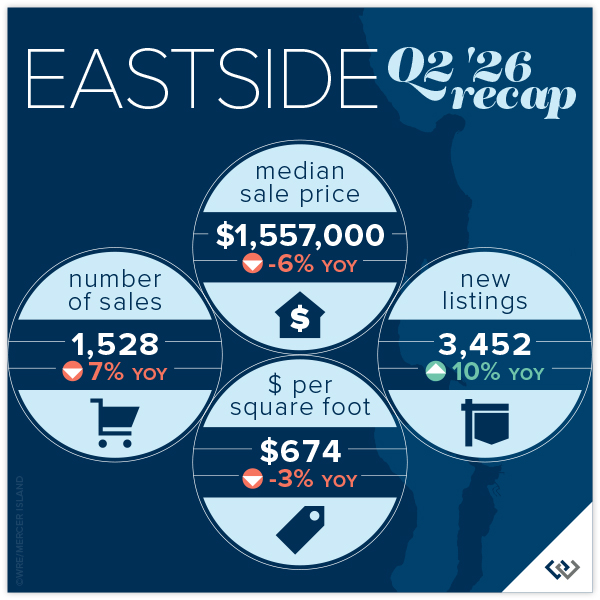
New listings hit a record high of 3,452 last quarter (or at least the 6 year high) and it appears that home shoppers were excited by the new inventory! 1,528 sales posted in Q2 of 2026. Even with this great news we are still living in a “feast or famine” era. With 3.7 months of Eastside inventory, again the highest we’ve seen in more than 6 years, it’s encouraging to see that 22% of homes sold with multiple offers. This lends statistical proof to what your agent has always told you: well prepared, strategically priced, “good” homes will be exciting in any market.
The median home price is down across the board, which makes sense given that sales are down 7% YOY and new listings are up YOY from 3,145 to 3,452 (10%). Mercer Island shows the lowest “dip” at a rounding error 1% drop in median price, while the area South of I-90 saw a 16% adjustment in the median dropping from $1,850,000 to $1,560,000.
If you’re thinking about “throwing your house in the ring,” it’s a coin toss: 51% of homes sold for at or above list and 52% of homes sold in the first 10 days. Proper pricing and preparation are key to beating those odds.
Click here for the full report and neighborhood-by-neighborhood statistics!

MERCER ISLAND
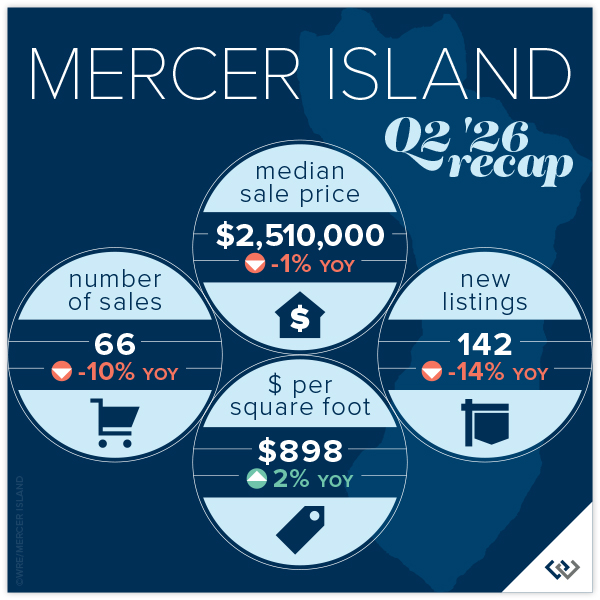
It appears that homeowners went into Q2 bullish on pricing and home shoppers did not share that value outlook; evidenced by the fact that 59% of homes sold for below asking price on Mercer Island. The median price is down during spring market for the second time in as many years, falling only 1% compared to 3% from 2024 to 2025. Moderate but still a sign that home prices are at their peak.
New listings are down 14% YOY and sales are down 10%. Even though this appears negative, we’re encouraged because of the relationship between these numbers. If new listings were up and sales were down or if sales were down less than new listings these would predict a worse outcome. You have to find a silver lining in a flat market.
With only 2 condo sales in Q2, the only conclusions we can really draw are 2 bedroom condos are the most popular product. There were 12 new listings and 9 listings at the end of the quarter which means at least one homeowner gave up. There are currently 12.9 months of condo inventory. With such little product it will only take a few sales in Q3 to drastically shift the market.
Click here for the full report and neighborhood-by-neighborhood statistics!
CONDOS – SEATTLE & EASTSIDE
The median price for Seattle condos dropped 7%, or $40,000, YOY. When you dig into the numbers this seems to be coming mostly from a 28% dip in North Seattle, which may just be from an easing in new construction condo-ized DADU listings. Across the rest of the landscape numbers are relatively flat and South Seattle posted a 9% gain!
On the Eastside there was an 11% dip in median prices led equally by Redmond, Woodinville and West Bellevue (all around 25% dips). These were balanced by more modest adjustments across the rest of the area with Mercer Island posting a 1% gain.
There is good news: 30% of condos sold in the first 10 days and 49% sold at or above list price across the region. This isn’t weighted in one direction, with relatively similar numbers posted both on the Eastside and in Seattle.
Check out area-by-area details in the full condo report.
WATERFRONT
Seattle and the Eastside both had a whopping 14 waterfront home sales in Q2, up significantly compared to Q2 of last year. Mercer Island also saw a year-over-year boost in sales from 4 to 6, while Lake Sammamish had a quieter quarter with just 5 sales compared to 13 in Q2 of 2025.
Hunts Point took the cake for highest sale with a 4.3-acre estate on over 300 feet of waterfront that went for a jaw-dropping $38 million. On the other end of the spectrum was a super cute, remodeled 1908 Rainier Beach home with 10 feet of waterfront that sold above asking price for $1,160,000.
This brief overview of the entire Seattle-Eastside private waterfront market, including Mercer Island and Lake Sammamish, illustrates the trends occurring in our region over time. This data is interesting and insightful but cannot replace an in-depth waterfront analysis with your trusted professional.
View the full waterfront report

We earn the trust and loyalty of our brokers and clients by doing real estate exceptionally well. The leader in our market, we deliver client-focused service in an authentic, collaborative, and transparent manner and with the unmatched knowledge and expertise that comes from decades of experience.
© Copyright 2026, Windermere Real Estate/Mercer Island. Information and statistics derived from Northwest Multiple Listing Service and Trendgraphix, and deemed accurate but not guaranteed.
Seattle report cover photo courtesy of Codi Nelson and Brad Crossen, HD Estates Photography.
Eastside report cover photo courtesy of Mike Ferreri and Kell Morrissey, Clarity NW Photography.
Mercer Island report cover photo courtesy of Petra Varney and Amaryllis Lockhart, Clarity NW Photography.
Condo report cover photo courtesy of Jake Kanev and FOCUSED Media Collective.
Homes That Earn Their Keep: Boost Your ROI with a Rental Unit

Do you have extra space in your home or on your property? You may be able to put it to work as a rental and boost your ROI! With rising interest rates and inflation putting economic pressure on homeowners, rental apartments and tiny houses can be a great way to offset those higher costs. Some homeowners are even living in the ADU unit themselves while a renter in the main unit helps pay the mortgage for the property. For seniors, the cost offset from a rental unit can be enough to allow them to age in place in their own home.
Easing regulations from Washington State’s middle housing bill (HB 1337, in addition to HB 1110) have made it easier to add an ADU, DADU, or duplex in areas that previously didn’t allow it (read our full article on permitting and regulations for ADUs). Here is the rundown on how to turn your extra spaces into profit…
THE RIGHT SPACE…
Whether you’re converting your existing property or looking to invest in something new, there are many options for creating a rent-able space. Just make sure you’re following local requirements (size, parking capacity, set-backs, etc.) set by your local city or county. ADUs require a special permit—here is a guide to permitting requirements throughout Washington State. If you’re considering adding an ADU/DADU, check out this article on the benefits, risks, and things to consider.
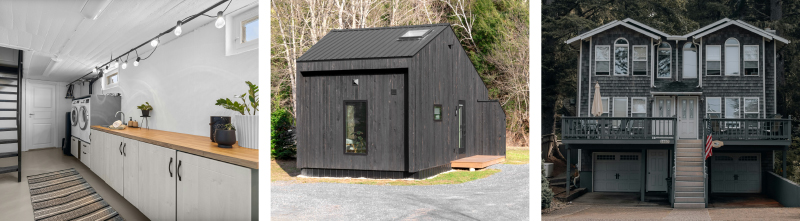
- ADUs (Accessory Dwelling Units), also known as in-law apartments, often take shape in converted basements, attics, or garages. They are self-contained living quarters within a larger single-family property that usually include their own kitchen/kitchenette, sleeping area, bathroom, and separate entrance.
- DADUs (Detached Accessory Dwelling Units) are ADUs that not physically connected to the main residence, sometimes referred to as tiny houses or granny cottages. They can either be constructed traditionally or installed as a prefab/modular unit. If you live in Seattle, consider using one of the 6 pre-approved ADU designs provided by the city; they speed up the permitting process from months to just weeks. You can even order pre-fab DADUs on Amazon.
- Small multi-family properties (like duplexes) have units that are typically larger, offer more privacy, and fetch higher rents than ADUs. However, they have special zoning requirements and may require special multi-family or investment financing. With the passage of Washington State House Bill 1110, they are permitted in many more areas than previously allowed.
THE RIGHT RENTAL TERM…
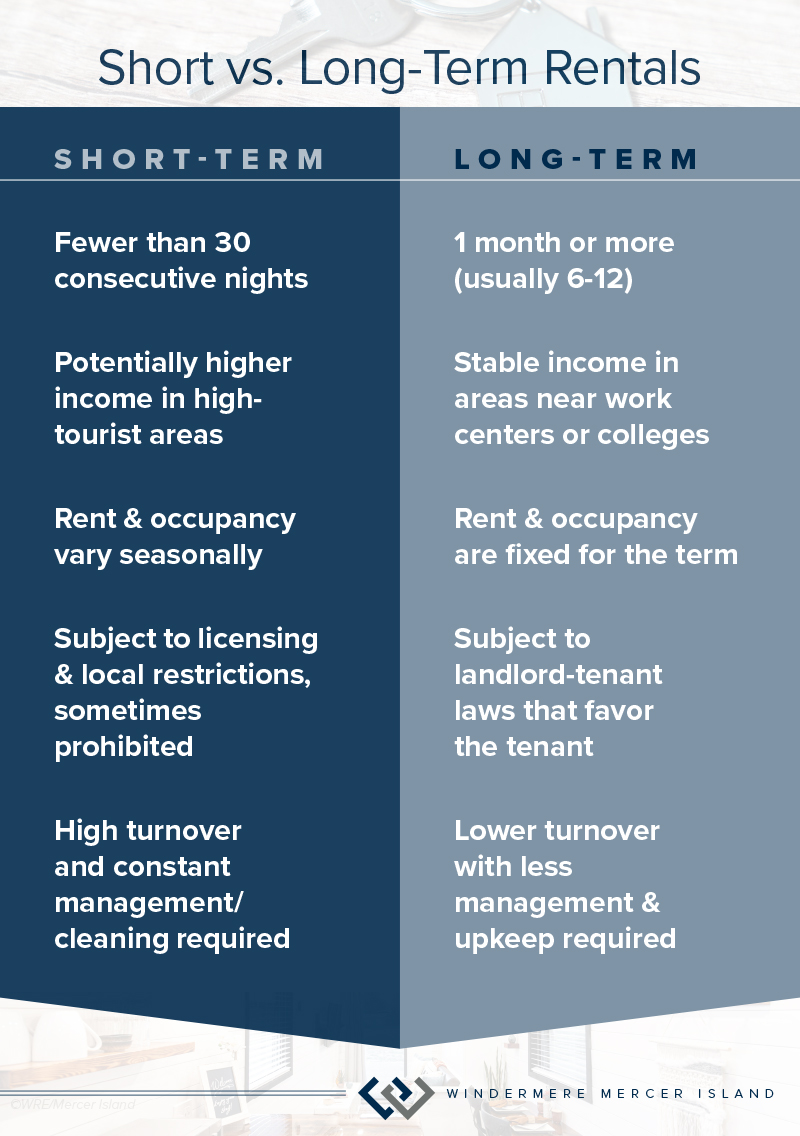
Once you determine the type of space you’d like to create, the next decision is whether you’ll be offering it as a long-term or short-term rental. Traditional long-term rentals with multi-month leases offer a stable income and are a great choice if your potential tenant would be working or attending school nearby. The low turnover rate also makes them relatively easy to manage apart from monthly rent collection and occasional repairs. The cons are that you have less flexibility to adjust the rent and are subject to often strict landlord-tenant laws that tend to strongly favor the tenant.
If you’re in a hot tourist area, offering your unit as a short-term rental on a platform like airbnb.com or vrbo.com can be a more lucrative option. Rental rates are typically much higher, however both rent and occupancy can vary seasonally. They also require constant management/cleaning due to their high turnover rate. Short-term rentals are subject to special licenses and restrictions, and are sometimes banned entirely by the city or your neighborhood Home Owner’s Association (HOA). Washington State also has special tax, insurance, and safety laws for short-term rentals.
No matter which type of rental you opt for, it is critical to do your homework and research requirements for licensing/permitting of rental properties in your community. From there you can delve deeper to estimate what your expenses and expected monthly rental income might be.
THE RIGHT PRICE…
Before you invest money into converting, building, or or purchasing a property with a rental unit, it is critical to compare estimated costs with the average rent for that type of unit in your area. The 2% rule in real estate investing holds that your expected monthly rent should be at least 2% of the purchase/construction price for it to be a good value. For example, if ADUs rent for $2,000/mo in your area then you should spend less than $100,000 on establishing an ADU. Here are the average ADU costs as of March 2026 according to WashingtonContrators.org:
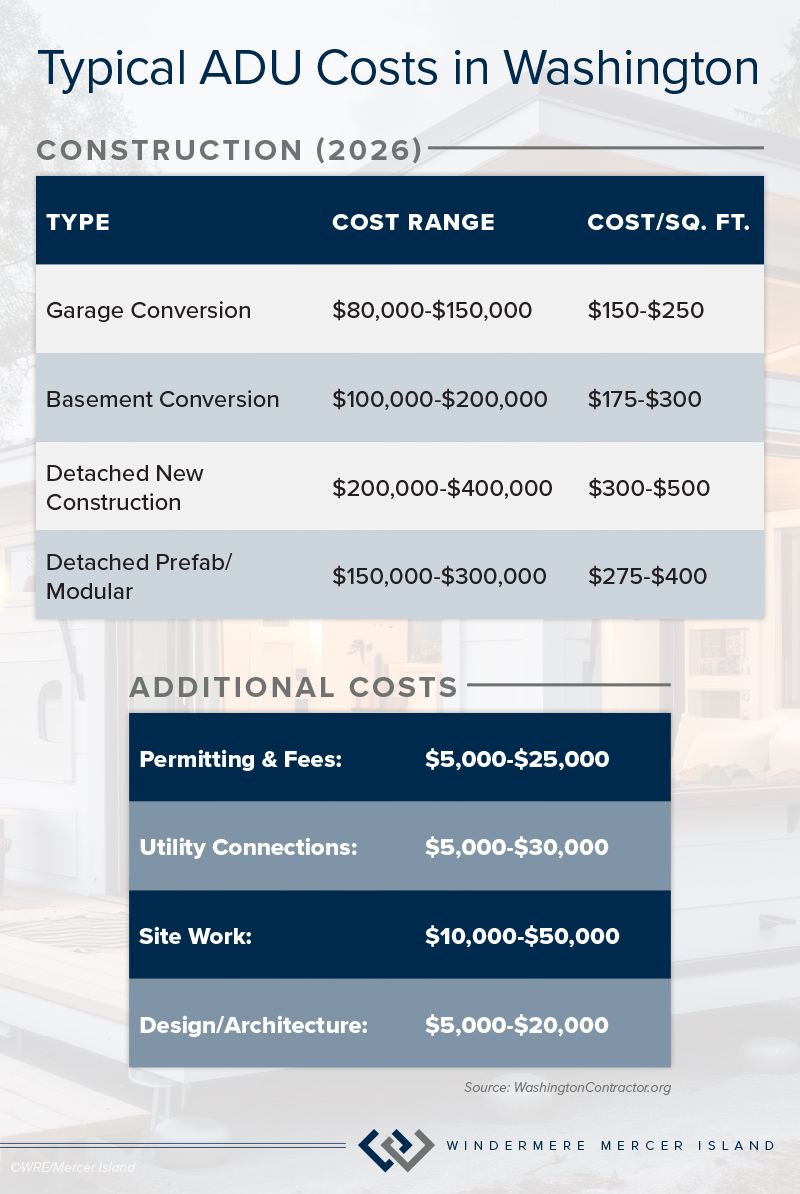
Did you know that HB 1337 also allows homeowners to sell an ADU separately from their main property? If you’re thinking about buying or selling a property with rental space, reach out to me to discuss the pros, cons, and pricing for your unique property. You can also check out these articles on how to design your rental to feel like a home, renovating short-term rentals, and tips to give your short-term rental a competitive advantage.

Chill Out: 5 Ways to Cool Your Home

Those dog days of summer are right around the corner, with El Niño also on its way and a season that’s predicted to lean even hotter than usual. Is your home ready to beat the heat? There are more approaches to cooling than many homeowners realize, with options to fit most budgets. Taking the plunge and installing air conditioning may also add value to your home when it’s time to sell. Here are 5 ways to chill out…
1. Install an Attic Fan
A more budget-friendly alternative to air conditioning, attic fans vent out hot air as it collects below the roofline. This makes a big difference for upper level rooms or 1-level homes that would normally be exposed to that heat radiation. Even if you already have A/C, an attic fan can help cut your cooling costs…by reducing the attic temperature by 10-20 degrees, contractors estimate that they reduce strain on your A/C system by about 30%. Just make sure your ceiling insulation is up to code so that you don’t inadvertently flush out your home’s cool interior air.
Standard fans need to be hardwired into your home’s electrical system. You can also opt for solar-powered fans that operate independently and are less expensive to install…BUT they’re usually less powerful than hard-wired versions.
2. Plant Shade Trees
Strategically planting trees along the southern side of your house is one of the most affordable and eco-friendly ways to keep your house cool. Consider choosing deciduous trees that will offer shade in the summer, then lose their leaves and allow light through in wintertime. Looking for a quick fix? Washington Hawthorn is a flowering tree that thrives in our climate and grows at a moderately fast rate of 1-2 feet per year. Even faster growing varieties to consider are willows, red maples, tulip trees, and certain varieties of oak like the Northern Red and hardy Nuttall. The birds and squirrels will thank you, too!

3. Incorporate Ceiling Fans
While they don’t reduce the air temperature, the breeze produced by ceiling fans does make you feel cooler. They can also help colder air circulate in at night. Even if you if you already have air conditioning, experts estimate that using a ceiling fan can allow you to raise your thermostat by 2 degrees…this translates to a 14% reduction in air conditioning costs over the course of the cooling season. Just make sure you set the blades to run downward (counter-clockwise) to create a draft. Bonus: ceiling fans are also helpful in wintertime to circulate rising warm air throughout the room; just lower the speed and reverse blades so they’re running clockwise.
4. Add A/C to Key Rooms
Ductless mini split heat pumps have drastically increased in popularity in the past several years thanks to their efficiency and cost effectiveness. As opposed to cooling the whole house, they give you the ability to cool only the rooms you use most (and also provide heat in the wintertime). Window units or portable air conditioners can provide similar singular-room cooling for a lot less than central air. These are also good choices for homes that don’t have the ducting required for A/C. While installing multiple mini splits can be costlier than central air, their higher efficiency will save you money each month with lower cooling costs.

5. Invest in Whole House A/C
A central forced-air cooling system is the best way to keep your whole house at a consistent temperature. Unlike mini-splits and portable units that are visible and can appear unsightly to some people, a central air system allows you to keep a clean look since the main unit is hidden out of sight. If you already have existing ductwork, it’s also usually less expensive to install than multiple mini split units. All that extra cooling does add to your monthly electric bill so look for an energy-efficient model. If it’s also time to replace your heating furnace, consider an Energy Star certified ducted heat pump. If you’re a PSE customer, rebates may be also available for switching to a heat pump.
Curious to know how these cooling improvements may affect your home’s value?
I am always happy to give you my expert opinion. Reach out any time to chat.
We earn the trust and loyalty of our brokers and clients by doing real estate exceptionally well. The leader in our market, we deliver client-focused service in an authentic, collaborative, and transparent manner and with the unmatched knowledge and expertise that comes from decades of experience.
© Copyright 2026, Windermere Real Estate/Mercer Island.
Planning Ahead: A 12-Month Guide to Buying Your First Home

Thinking about buying a home can be daunting, especially if it’s your first time. What should be an exciting milestone can feel overwhelming without a clearly defined roadmap, and diving in headfirst without a solid plan can lead to unnecessary stress, financial surprises, and missed opportunities. However, by establishing a timeline and breaking the process down into manageable steps, you can move forward with confidence and clarity.
Here is your month-by-month guide to preparing for a successful home purchase in the following year.
12 – 10 MONTHS OUT
Know Your “Why”
Understand your motivation for buying. Are you relocating, growing your household, or ready to invest in your future? Clearly defining your “why” will help shape your search criteria and influence your budget, location, and timeline.
Set Clear Goals
Start to think about what you want in your new home. Create a list of your wants versus must-haves, including location, budget, size, and style of home. These goals will act as a compass throughout your search. Be sure to include your ideal timeline and what you hope to get out of the overall experience.
Find an Agent Who Prioritizes Your Goals and Timeline
A trusted real estate agent is more than just a facilitator; they’re a guide, negotiator, and advocate. Look for someone who understands your timeline and long-term vision and is familiar with the local market. Ask them to provide a first-time buyer’s guide or checklist to help you get started. Building this relationship early allows your agent to understand your needs and preferences in advance, setting the stage for a smoother process when you’re ready to make your move.
9 – 7 MONTHS OUT
Assess Your Finances
Take a close look at your income, debt, and spending habits. Use this time to create a monthly budget that includes future mortgage payments, utilities, insurance, taxes, and home maintenance. Many experts recommend spending no more than 28% of your gross monthly income on housing costs.
Boost Your Credit
Your credit score has a significant impact on your buying power, including your mortgage rate and loan approval. Take the next few months to pay down high-interest debt, stay current on all payments, and avoid opening new credit accounts. Check your credit report for errors and work on improving your score if needed.
Start Saving
You’ll want to have enough set aside not only for a down payment, which is typically 3% to 20% of the purchase price, but also for closing costs, moving expenses, and initial home repairs or furnishings. During this time, try to avoid nonessential major purchases and think about setting up a dedicated home savings account to stay consistent.
6 – 4 MONTHS OUT
Talk to a Financial Advisor
A financial advisor can help you align your financial goals with your homebuying plans. They can offer advice on what you can realistically afford and help identify areas to strengthen your financial readiness. You can also use tools like an online mortgage calculator to get a clearer idea of what your future monthly payments might look like.
Research Homebuyer’s Courses & Guides
Take advantage of first-time homebuyer resources, guides, and online courses. The more you know earlier on, the more confident you’ll feel.
3 – 2 MONTHS OUT
Familiarize Yourself with the Market
Start browsing homes and monitoring prices in the neighborhoods you’re interested in. Learn whether your local market is currently favoring buyers or sellers and what that could mean for your strategy.
Meet with a Lender and Get Pre-Approved
Meeting with a lender and getting pre-approved can help give you a clear picture of how much you can borrow and what price range to shop within. It also shows sellers that you’re a serious buyer when the time comes to make an offer. Your realtor can recommend trusted lenders to work with and assist you through this process.
Start Your Home Search
Now that you have your list of wants and needs and know your price range, you’re ready to start searching for your dream home. Use online property research tools to filter by location, features, and price to see what’s available in the locations you like. Narrow down your top homes and start scheduling showings and comparing listings.
1 MONTH OUT
Make an Offer
Once you find “the one,” your agent will help you craft a competitive offer, negotiate terms, and guide you through contingencies.
Get a Home Inspection
If your offer is accepted, a licensed inspector will identify any issues with the property before you finalize your purchase. Depending on what comes up, this can give you leverage to negotiate repairs or price adjustments.
THE TIME HAS COME
Closing On Your New Home
You’ve made it! During closing, you’ll sign paperwork, pay final costs, and receive the keys to your new home. Your agent and lender will walk you through the final steps to ensure everything goes smoothly.
Buying a home may seem like a big leap, but with a solid 12-month plan and the right support, it can be an extremely rewarding experience. Take it one step at a time and know that I’m here to help whenever you’re ready.
This article originally appeared on the Windermere Blog
We earn the trust and loyalty of our brokers and clients by doing real estate exceptionally well. The leader in our market, we deliver client-focused service in an authentic, collaborative, and transparent manner and with the unmatched knowledge and expertise that comes from decades of experience.
© Copyright 2026, Windermere Real Estate/Mercer Island.
2026 Seattle & Eastside Farmers Markets

Wow, spring has sprung and 2026 is flying by…ready to renew your New Year’s resolution to eat better? Nothing makes it easier than a wide array of fresh, locally picked fruits and veggies. Add in some live music, amazing street food, and that feel-good knowledge that you’re supporting small businesses, and it’s a recipe for a great time. Here are all of the details so you can find a market near you or explore somewhere new…
Seattle Metro
- Ballard
- Capitol Hill (Broadway)
- Central District (Madrona)
- Columbia City
- Fremont
- Lake City
- Lake Forest Park
- Madison Park
- Magnolia
- Phinney
- Pike Place
- Queen Anne
- Shoreline
- South Lake Union – Thursday Market
- South Lake Union – Saturday Market
- U-District
- Wallingford
- West Seattle
Greater Eastside
- Bellevue – Crossroads
- Bellevue – Downtown
- Carnation
- Duvall
- Issaquah
- Kirkland – Downtown
- Kirkland – Juanita
- Mercer Island
- North Bend
- Redmond
- Renton
- Sammamish
- Woodinville

Seattle Metro
Ballard
Seattle’s first year-round Farmers Market, selling produce exclusively from Washington state farmers along the historic cobblestone stretch of Ballard Ave.
Sundays, 9am – 2pm | Year-Round
5345 Ballard Ave NW | Seattle
sfmamarkets.com/visit-ballard-farmers-market/
Capitol Hill (Broadway)
Come for Sunday brunch from food vendors who source ingredients from local, WA state farms (many of whom you’ll also meet selling their wares at the market). Live music and street performers often make an appearance, too.
Sundays, 11am – 3pm | Year-Round
Tuesdays, 3pm – 7pm (June 2 – September 29, 2026)
E Barbara Bailey Way | Seattle
seattlefarmersmarkets.org/chfm
Central District (Formerly Madrona)
Located in one of Seattle’s most diverse neighborhoods, you’ll find artisan foods as well as seasonal produce from Washington state farmers, fishers, and ranchers.
Fridays, 3pm – 7pm | May 15 – Oct 30, 2026
MLK Way & E Union St | Seattle
sfmamarkets.com/central-district-farmers-market
Columbia City
With everything from freshly harvested Asian greens to Ethiopian eats, come check out the immense variety King County’s most diverse zip code has to offer. Bring your bounty to adjacent Columbia Park for a picnic.
Wednesdays, 3pm – 7pm | May 6 – Oct 28, 2026
37th Ave S & S Edmunds St | Seattle
seattlefarmersmarkets.org/ccfm
Fremont
Seattle’s largest weekly street market is set along the Fremont Canal, and you can find just about everything at this “hyper market”—an eclectic mix of a farmer’s market, flea market and artists’ alley. The brunch food is pretty epic, too!
Sundays, 10am – 4pm
March 29-October: 3401 Evanston Ave N | Seattle
Nov-March: 701 N Northlake Way | Seattle
fremontmarket.com
Lake City
This celebrated North End seasonal market offers unique finds grown and prepared by local farms and food artisans. Enjoy kids’ activities, too!
Thursdays, 3pm – 7pm | June 4 – Sept 24, 2026
Saturdays, 10am – 2pm | Oct 3 – Dec 19, 2026
NE 125th St & 28th Ave NE | Seattle
seattlefarmersmarkets.org/lcfm
Lake Forest Park
With an emphasis on fresh, locally grown food, this market is an epicurean’s delight. Browse hard cider, baked goods, preserves, meat, pasta, sauces, and prepared foods along with the locally harvested fruits and veggies. There is also one “Crafts Market” each summer featuring local artisans.
Sundays, 10am – 2pm | May 10 – Oct 18, 2026
17171 Bothell Way NE | Lake Forest Park
www.thirdplacecommons.org/farmers-market
Madison Park
Stretching right alongside the park with its bathhouse and swimming beach, you’ll find ample produce from Washington State farms as well as delectable hot food vendors.
Saturdays, 10am – 2pm | May 16 – Oct 17, 2026
E Madison St & 42nd Ave E | Seattle
www.sfmamarkets.com/madison-park-farmers-market
Magnolia
This popular Saturday market is nestled in the tree-lined Magnolia Village. In addition to seasonal fruits and veggies, you’ll find sweet & savory pies, fresh bread, flowers, and more!
Saturdays, 10am – 2pm | June 6 – Oct 10, 2026 + Nov 21 & Dec 5
W McGraw St & 33rd Ave W | Seattle
seattlefarmersmarkets.org/mfm
Phinney
A popular gathering spot for both the Phinney Ridge and Greenwood communities, this market is right next door to a playground and offers live music in addition to the great mix of fresh produce and prepared food.
Fridays, 3pm – 7pm | June 5 – Sept 25, 2026 + Harvest Market on Nov 20
6532 Phinney Ave N | Seattle
seattlefarmersmarkets.org/pfm
Pike Place
Produce on Pike extends the standard market with pop-up tents from local farmers along the north end of Pike Place. Of course, you can come enjoy the historic indoor market any time…make it a day with great restaurants, eateries and retail shops, too.
Produce on Pike Farmers Market:
Wednesdays, 3pm – 7pm | June 24 – Sept 9, 2026
Stewart Street & Pike Place | Seattle
pikeplacemarket.org/farmers-markets
Indoor Market:
Daily, 9am – 6pm (farm tables close at 4pm) | Year-Round (Closed Thanksgiving & Christmas)
Pike Place between Pine & Virginia St | Seattle
(206) 682-7453
pikeplacemarket.org
Queen Anne
Seattle’s only independent farmers market, offering food, chef demos, live music, and children’s activities.
Thursdays, 3pm – 7:30pm | May 28 – Oct 8, 2026
Spring Preview Market on Sat, May 9, 2026, 10am-3pm
Saturday Harvest Markets on Oct. 31 & Nov. 21, 10am-3pm
Queen Anne Ave N & W Crockett St | Seattle
qafm.org
Shoreline
Now located at the BikeLink Park & Ride (corner of 192nd & Aurora, across from Sky Nursery), this market offers kids’ programs and live music in addition to its fresh Washington produce, organic meats, bread, honey, and prepared foods.
Saturdays, 10am – 2pm | June 6 – Oct 31, 2026
18821 Aurora Ave N | Shoreline
shorelinefarmersmarket.org
South Lake Union – Mini Thursday Market
Affiliated with Pike Place Market, this small satellite market offers locally sourced veggies, fruits, flowers, honey, jam, and organic meats from the region’s finest farms.
Thursdays, 10am – 2pm | June 4 – Oct 29, 2026
426 Terry Avenue N | Seattle
pikeplacemarket.org/farmers-markets/
South Lake Union – Saturday Market
This year, the former maker’s market is evolving into a full blown farmers market complete with over 100 booths and Space Needle views.
Saturdays, 10am – 3pm | June 6 – Nov 21, 2026
2100 6th Ave | Seattle
slumarket.com
University District
Come visit Seattle’s largest and oldest farm/food only market, regularly recognized as one of the best farmers markets in the U.S.! With over 80 booths and hard-to-find ingredients, it’s a chef’s delight.
Saturdays, 9am – 2pm | Year-Round
University Way NE (the “Ave”) between 50th & 52nd | Seattle
seattlefarmersmarkets.org/udfm
Wallingford
Located in Meridian Park, you can shop with the whole fam and then enjoy a picnic or playtime at the award-winning playground.
Wednesdays, 3pm – 7pm | May 27 – Sept 30, 2026
4800 Meridian Ave N | Seattle
sfmamarkets.com/visit-wallingford-farmers-market/
West Seattle
A weekend destination for families across the area, this market is set in the vibrant West Seattle Junction and features 90+ vendors during the summertime peak. Great community atmosphere celebrating Washington grown food and ingredients.
Sundays, 10am – 2pm | Year-Round
California Ave SW & SW Alaska | Seattle
seattlefarmersmarkets.org/wsfm
Greater Eastside
Bellevue – Crossroads
East Bellevue’s market features fruits, veggies & dairy products from Washington state farms along with hand crafted bird houses, candles, dog accessories, herbal wellness products, and more. Don’t miss the tacos, Nepalese street food, and handmade ice cream sandwiches, too!
Tuesdays, 12pm – 6pm | June 2 – Sept 29, 2026
15600 NE 8th St | Bellevue
https://crossroadsbellevue.com/music-events/crossroads-farmers-market/
Bellevue – Downtown
Set in the heart of Downtown Bellevue, this market offers goods exclusively produced within Washington state—from seasonal fruits & veggies to flowers, fresh meats, artisan goods, and prepared cuisine. The Power of Produce (POP) club empowers kids to know where their food comes from and make healthy eating choices.
Thursdays, 3pm – 7:30*pm | May 21 – Oct 1, 2026
*Closes at 7pm in Sept & Oct
Harvest Market: Nov 21, 10am – 3pm
1717 Bellevue Way NE | Bellevue
bellevuefarmersmarket.org
Carnation
Set in the heart of the Sno-Valley farming district, you’ll find plenty of freshly picked produce along with live music and educational activities for the kids.
Tuesdays, 3pm – 7pm | June, July & August 2026
Tolt-MacDonald Park, 31020 NE 40th St | Carnation
carnationfarmersmarket.org
Duvall
Nestled alongside the scenic Snoqualmie River, this friendly market features local eggs, jams, fresh roasted coffee, arts, crafts, and baked goods in addition to the seasonal veggies, fruits, and plant starts. Live music, picnic shelters and a playground make this a fun family destination.
Thursdays, 3pm – 7*pm | May 7 – October 8, 2026
*Closes at Sunset in October
Taylor Landing at 16201 Main St NE | Duvall
Parking Map
duvallfarmersmarket.org
Issaquah
Located at the historic Pickering Barn, this picturesque venue offers a variety of fresh farm and food-based products, concessions, and local artisans.
Saturdays, 9am – 2pm | May 2 – Sept 26, 2026 + Holiday Market Dec 12
Pickering Barn, 1730 10th Ave NW | Issaquah
Market Map
www.issaquahwa.gov/778/Farmers-Market
Kirkland – Downtown
This stunning setting on the Lake Washington shoreline turns shopping into a day at the beach. Peruse local produce and goods, then go for a swim or stroll along Moss Bay. Perfect for a picnic, too!
Wednesdays, 3pm – 7pm | June 3 – September 30, 2026
Marina Park, 25 Lakeshore Plaza | Kirkland
kirklandmarket.org
Kirkland – Juanita
Set in beautiful Juanita Beach Park on Lake Washington, you’ll find as many as 30 vendors offering farm fresh local produce, herbs, honey, nuts, flowers, plants, baked good, handcrafted items, and prepared cuisine. Make it a date with live music and a picnic at the beach. There’s a great playground for the kids, too.
Fridays, 3pm – 7pm | June 5 – Sept 25, 2026 (Closed June 19 & July 3)
Juanita Beach Park, 9703 NE Juanita Dr | Kirkland
www.kirklandwa.gov
Mercer Island
Come on down for quality local Washington state produce, cheese, fish, meat, bread, and more. Check out the live music schedule, too!
Sundays, 10am – 2pm | May 31 – Oct 11, 2026
Mercerdale Park, 7700 SE 32nd St | Mercer Island
www.mifarmersmarket.org
North Bend
This relaxed market enjoys live music and a spectacular Mount Si view. Vendors offer fresh produce, berries, honey, flowers, baked goods, hand-crafted items, and delicious prepared foods. Kids can participate in the Power of Produce (PoP) Club. Two playgrounds plus play fields and a covered picnic shelter make this a fun hangout spot. Leashed pets are welcome, too!
Thursdays, 4-8*pm | June 4 – Sept 3, 2026
*3:30 pm – 7:30 pm on Aug 27 & Sept 3
Si View Park, 400 SE Orchard Dr | North Bend
www.siviewpark.org/farmers-market.phtml
Redmond
Going strong since 1976, the Redmond Saturday Market offers a huge selection of vendors and dazzling array of produce, flowers, cheeses, preserves, salmon, tea, and handmade goods such as pottery and soaps. You’ll love the ready-to-eat foods, too.
Saturdays, 9am – 2pm | May 2 – Oct 31, 2026 (Closed May 9th)
9900 Willows Rd NE | Redmond
www.redmondsaturdaymarket.org
Renton
Find exclusively Washington-produced fruits, veggies, handmade goods, arts, crafts and more right in the heart of downtown Renton. Food trucks, live music, and kids’ activities make this a fun spot to liven up your Tuesday. Note: for 2026, the market returns to Piazza Park!
Tuesdays, 3pm – 7pm | June 2 – Sept 29, 2026
Piazza Park at 233 Burnett Ave S | Renton
www.rentonfarmersmarket.com
Sammamish
Each Wednesday, the Sammamish Commons plays host to a variety of local farmers, nurseries, bakeries, artisans, food vendors, and more. Live music and kids’ activities, too! Check out their special themed days including Soccer Fest and Pride Day.
Wednesdays, 4-8*pm | May 6 – Sept 9, 2026
*3-7 pm in Sept
Sammamish Commons, 801 228 Ave SE | Sammamish
Parking: Mary, Queen of Peace Catholic Church, 1121 228th Ave SE
www.sammamishfarmersmarket.org
Woodinville
Come check out downtown Woodinville’s Schoolhouse District and find produce grown in the state of Washington (and picked fresh for that morning!). You’ll also have an array of boutique baked goods, sauces, cider, artisans, and more to peruse.
Saturdays, 10am – 2pm | May 2 – Sept 26, 2026
13205 NE 175th St | Woodinville
woodinvillefarmersmarket.com
We earn the trust and loyalty of our brokers and clients by doing real estate exceptionally well. The leader in our market, we deliver client-focused service in an authentic, collaborative, and transparent manner and with the unmatched knowledge and expertise that comes from decades of experience.
© Copyright 2026, Windermere Real Estate/Mercer Island.
How’s the Market? Q1 2026 Review of Seattle Area Real Estate

Across the region, median sales prices were lower than we saw at this time last year. The likely cause: more homes are hitting the market, but buyers (rattled by rising rates, layoffs, and an uncertain economy) aren’t keeping pace. That being said, we are still seeing many homes sell in their first 10 days on market with the choicest homes drawing multiple offers and selling above the asking price. The market is complex and every home is different…part of my job is to look beyond the averages to get a clearer understanding of what is happening at the neighborhood level.
Despite the push in interest rates, it continues to be a good time to invest and find the right home! Buyers who are up-sizing have a special advantage when prices dip since the money they save on their purchase often exceeds the lower ROI from their sale.
Click or scroll down to find your area report:
Seattle | Eastside | Mercer Island | Condos | Waterfront
SEATTLE
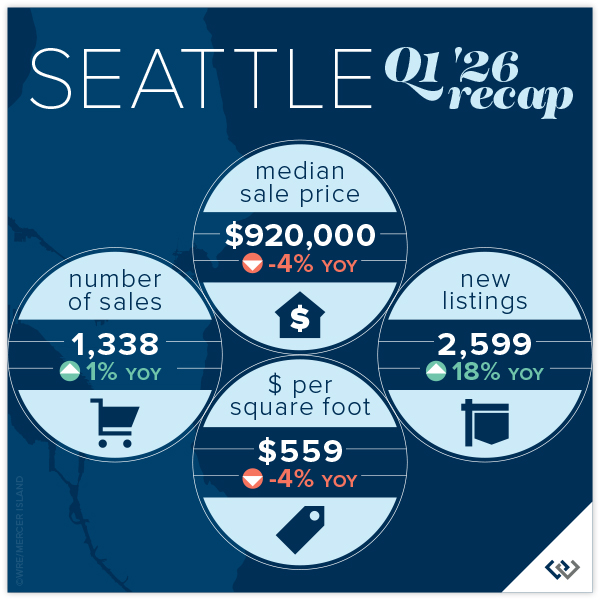
When you look past the overall data, Seattle real estate is firing on all cylinders. Even though the median price is down YOY from $958,000 in 2025 to today’s $920,000 the actual median price point is hot, in city. We’re hearing tales of multiple offers in the $800,000-$1,200,000 price range from all corners of the core Seattle neighborhoods. 67% of homes sold for at or above list price, those that sold above sold for 104% (median) over list! The entire market average list to sales price is 101%, which bodes well for gains YOY in Q2.
West Seattle and Madison Park seem to be carrying the market, the only two neighborhoods to post stable or even a modest gain in price. Maybe not so ironically, Shoreline and Lake Forest Park saw among the highest gain in overall sales volume but also the biggest losses in median price at 10%. Shoppers are savvy and know when they’ve found a deal.
While our market is facing existential pressure from things like rising interest rates, war, and talks of recession; the city hasn’t looked this beautiful in years as officials prepare for World Cup festivities in a few months. There is always a bright side, and homebuyers appear to be seeing the silver lining as they consider their long-term investment plans. If you’ve thought about selling your home in 2026, we think this could be a great year: sales are happening, 55% within the first 10 days.
Click here for the full report and neighborhood-by-neighborhood statistics!

EASTSIDE
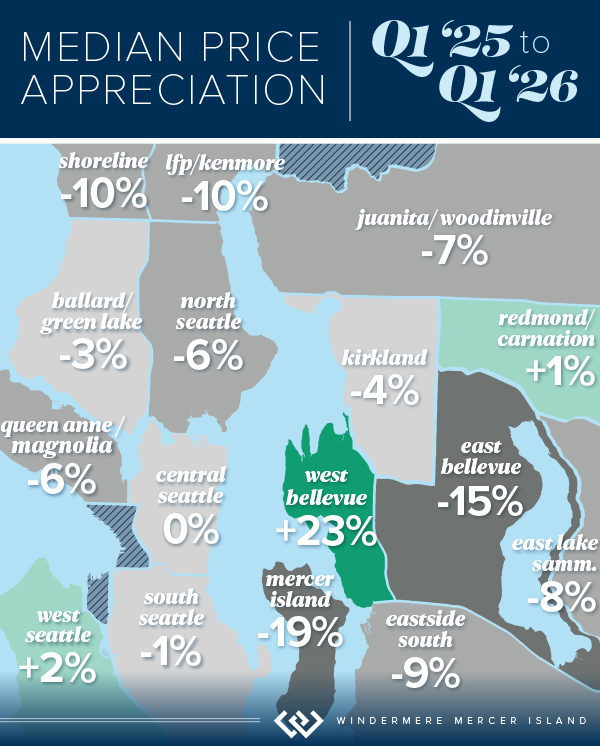
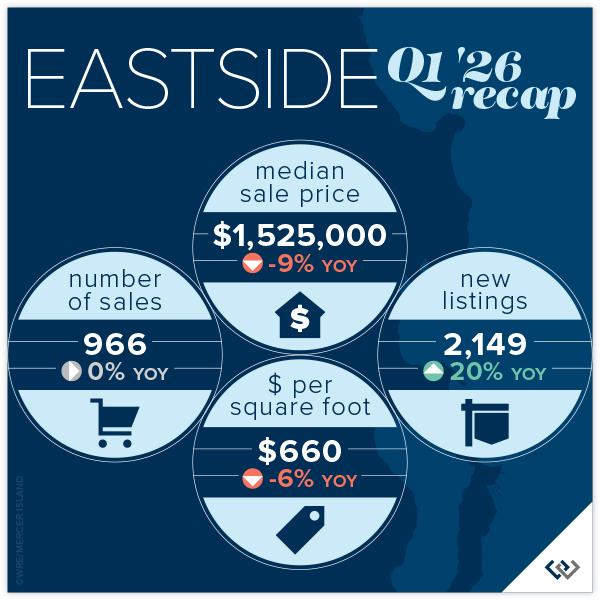
While median prices across the Eastside fell from $1,678,000 in Q1 2025 to $1,520,000, this quarter there are still bright spots. Namely, West Bellevue whose median price jumped 23% YOY. Though while the total number of sales were up in nearly every Eastside city, West Bellevue’s 36% dip drug the market down to report flat total sales: 966 at the end of Q1 2026 compared to 969 in the same period last year.
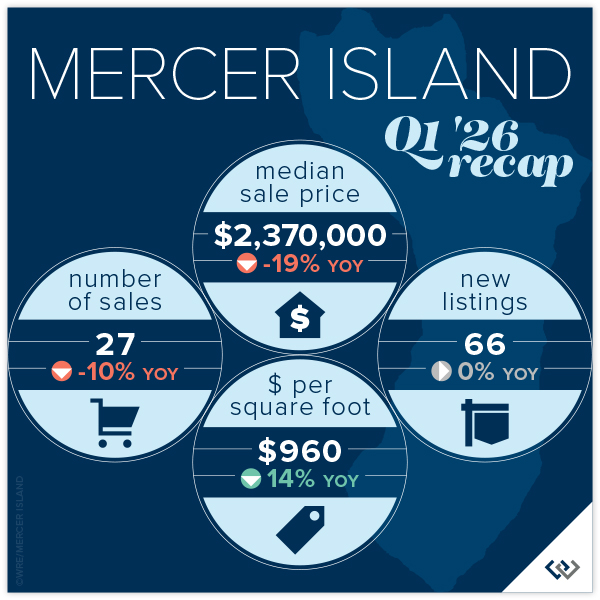
Mercer Island reported a region-wide high gain in average price per square foot at 14%, and West Bellevue was not far behind at 2%. All other neighborhoods had dips, topped by Redmond which fell 10%.
New listings rose 20% YOY, and this could mean many things but we think the two most likely are: home sellers got a head start in 2026 (we predict fewer new listings in Q2 than last year when new inventory nearly doubled from one quarter to the next) OR everyone else is as bullish about the market as we are. List to sales price ratios are at 99% on average and 51% of homes sold in the first 10 days. If you find the right home, don’t be afraid to jump.
Click here for the full report and neighborhood-by-neighborhood statistics!

MERCER ISLAND
Island real estate seems to be off to a slow start in 2026 with median prices slipping YOY from $2,937,000 in 2025 to $2,370,000 in 2026. This is likely due to a spike in the months of inventory: 4.7 up from 2.9 last Q1. The months of inventory is a barometer for which way prices trend. High inventory = falling prices, supply/demand. That said, 60% of all homes sold for at or above list price and 63% sold in the first 10 days. Both of these numbers are indicators that homeowners are pricing to sell.
The condo market appears to be healthy this spring. Even though there are only 8 total sales that number is up a whopping 60% YOY. Median price is down 33%, but this is a rounding error with only 8 data points this year and 5 last year. A better indicator of market health is a 2.2 months supply of inventory, which is outpacing pretty much any segment of the market!
While our market is facing existential pressure from things like rising interest rates, war, and talks of recession; Mercer Island is now the “Bridge” in a whole new way with light rail open from Seattle to the Eastside. It will be interesting to see how this fun change affects the market as a whole.
Click here for the full report and neighborhood-by-neighborhood statistics!
CONDOS – SEATTLE & EASTSIDE
Seattle condo sales are up 8% over Q4 2025, an incredible seasonal boost. Though, the median price is down 6% YOY to $596,000. 25% of listed condos sold in the first 10 days and 48% of all condos sold for at or above list price. This tells us that agents and homeowners are tuned in to what a homebuyer in today’s market expects.
On the Eastside it’s a very similar story. Inventory is at 5.1 months. Meaning: at the current pace of sales, if no new listings came on the market, it would take nearly half a year to sell through the current inventory. That’s the highest since before 2020, the six year low was Q4 of 2021. Prices seem to reflect this, with an 11% dip in median home price down to $655,000 from Q1 2025: $740,000.
If you’ve thought about selling your condo in 2026, prepare for a highly saturated market where you’ll need to whip your unit into tip-top shape and price competitively to attract buyers. Inventory is up a combined 5%, while sales are down 21%. This is a big gap that will definitely create downward pressure on pricing if the gap between demand and supply widens. If you have the luxury to wait and watch, that might be your best option. If you’ve thought about buying, this is an excellent year to consider your options. Just remember, if you find the right nest and it hasn’t been on the market long: jump in! The good ones don’t last.
Check out area-by-area details in the full condo report.
WATERFRONT
Seattle and the Eastside both had fewer waterfront sales this quarter than we saw in Q1 of 2025, whereas Lake Sammamish posted the same number of sales and Mercer Island saw a boost. The vast majority of homes sold at or below their listed prices with the exception of one mid-century Magnolia home on 75 feet of waterfront that garnered over $300k above and beyond its original asking price.
The highest sale was in Hunts Point at $17+ million for a stunningly reimagined English Tudor on 3/4-acre with extensive waterfront. The most modest sale was in Rainier Beach: an original 1980 home on 50 feet of waterfront that went for $1,640,000.
This brief overview of the entire Seattle-Eastside private waterfront market, including Mercer Island and Lake Sammamish, illustrates the trends occurring in our region over time. This data is interesting and insightful but cannot replace an in-depth waterfront analysis with your trusted professional.
View the full waterfront report

We earn the trust and loyalty of our brokers and clients by doing real estate exceptionally well. The leader in our market, we deliver client-focused service in an authentic, collaborative, and transparent manner and with the unmatched knowledge and expertise that comes from decades of experience.
© Copyright 2026, Windermere Real Estate/Mercer Island. Information and statistics derived from Northwest Multiple Listing Service and Trendgraphix, and deemed accurate but not guaranteed.
Seattle report cover photo courtesy of The Sirianni Group; and Andrew Webb, Clarity NW Photography.
Eastside report cover photo courtesy of Tori Franzen; and Michael Tilzer Photography.
Mercer Island report cover photo courtesy of Julie Wilson; and Chris Neir, Clarity NW Photography.
Condo report cover photo courtesy of Marianne Parks; and Christopher Cooper, Clarity NW Photography.
Helpful Hacks to Make Spring Cleaning a Breeze

Spring is almost here, and with it comes that yearly urge to polish away the winter grime. Before you plunge into a multi-day cleaning spree, however, (or burn yourself out and put it off until next year) try these helpful tips. They just might win you a few hours back in your quest for clean…
1. Work Top to Bottom
Working from ceiling to walls to counters to floors guides dust and debris downwards and prevents any re-cleaning of the same areas. Here’s a room by room checklist so you don’t miss anything:

2. Use the Dishwasher for More than Dishes
Disassemble dusty glass ceiling fixtures and light covers, then throw them in the dishwasher for a zero-effort sparkle. Ditto for children’s toys, glass candle holders, and microwave vent screens.
3. Dust Fan Blades with a Pillowcase
Make quick work of a gross fan blade by enclosing it in an old pillowcase which you hold shut as you pull it back off the blade. Step outside to shake out the dust bunnies, then repeat with the remaining blades.

Photo by Curtis Adams
4. Throw Draperies in the Dryer
For curtains that aren’t machine washable, you can still do a quick and easy refresh by putting them in the dryer for 15 minutes on no/low heat. Some dryers even have a steam setting to help gently reduce wrinkles and odors. Worried about dust mites? Either raise the dryer heat to high for fabrics that can take it, or bag up delicate curtains and freeze them for 24 hours.
5. Wash Windows When They’re Cool
Direct sunlight heats window glass, causing unsightly streaks to form before you have the chance to wipe them away. Wash them in the morning or on a cloudy day so that you only have to clean them once!

Photo by Liliana Drew
6. Let the Microwave Clean Itself
Add a few tablespoons of vinegar or some thin citrus slices to 2 cups of water. Microwave on high until it starts to boil, let sit for 5 minutes, then easily wipe clean with a paper towel or cloth.
7. Use Baking Soda on the Oven Door
Save a little elbow grease by mixing baking soda and water to form a thick paste, then spreading and letting it sit on the open oven door for 20 minutes. Gently wipe with a microfiber cloth, rinse and buff dry for a sparkling finish.
8. Shine Stainless Steel with Olive Oil
For an easy, chemical-free fix, put a little olive oil on a cloth and use it to polish away smudges and stains from your stainless-steel appliances/grill. You can find more ideas in this article on natural cleaning solutions.

Photo by RDNE Stock project
9. Naturally Clean the Dishwasher
Clean any gunk out of the drain filter, then fill a dishwasher safe container with one to two cups of vinegar and place it in the top rack. Run a cycle without dishwasher detergent nor other dishes. Once the cycle is complete, sprinkle roughly a cup of baking soda along the bottom rack and run another cycle.
10. Put Garbage Disposal Gunk on Ice
Put a handful of ice cubes down the garbage disposal along with either 1 cup coarse salt or cut up lemon pieces with the peels on. Turn on the cold water and run the disposal until everything is ground up and cleared out. Continue running and flushing with cold water for another minute. Bonus: the ice will also scrape and sharpen the blades.
11. Machine Wash Shower Curtains
Did you know your shower curtain liner can be cleaned in the washing machine? The trick is to throw in a small bath towel with it to help scour away soap scum + that weird pink stuff. Add 1/2 cup vinegar during the rinse cycle (you can use the fabric softener dispenser) to reduce mold and mildew.

Photo by RDNE Stock project
12. Bag Scum on Your Shower Head
Combine equal parts vinegar and water in a plastic bag. Tie it around your shower head so that it’s completely submerged, then soak for at least an hour. Blast the hot water to clear out any residue.
13. Use a Lint Roller on Fabric Surfaces
Great for dusting lampshades, fabric window shades, and speaker covers. It can also remove stubborn pet hair from upholstery.
14. Get the Funk Out
Deodorize carpets by sprinkling them with baking soda, working it in with a broom or soft brush, letting it sit for 30 minutes, and then vacuuming. You can use the same technique (minus the brushing) on funky mattresses.
15. Become a Robot Overlord
Once a novelty, robot vacuums have improved by leaps and bounds and are now a legitimate way to clean & mop your floors with minimal effort. Spring Cleaning may be the perfect time to invest in one and free up your time for more involved tasks.

Photo by Kindel Media
Need Some Motivation?
- Offer to host an event in the near future so that you have a deadline to work toward.
- Try organizer Shira Gill’s “15-minute win” by challenging yourself to tackle a single spring cleaning task each day…this can help you feel accomplished rather than overwhelmed, and those small tasks will add up to an extra-clean house before you know it.
- Don’t forget the power of music! You’d be surprised how much your favorite upbeat tunes can lift your mood and keep you going.
Cleaning to Sell?
Here’s a printable checklist specifically for cleaning and preparing your home for market:

We earn the trust and loyalty of our brokers and clients by doing real estate exceptionally well. The leader in our market, we deliver client-focused service in an authentic, collaborative, and transparent manner and with the unmatched knowledge and expertise that comes from decades of experience.
© Copyright 2026, Windermere Real Estate/Mercer Island.
The Pitfalls of Overpricing Your Home

When a homeowner prepares to put their house up for sale, two things are usually top of mind: how long will it take to sell and how much can we get for it. During a seller’s market, when stories of bidding wars and cash offers abound, it can be tempting to put as high a price tag on your home as possible. But even when the market favors sellers, overpricing your home can jeopardize your efforts to sell quickly and get top dollar.
Missing Your Market
The vast majority of homebuyers start their search online, and the first criteria they often enter is the price range. If your home is above the high point of their range, buyers in your target market will never even see your listing—it simply won’t show up in their searches. In addition, it’s human nature to go after the top item in a collection. Buyers want the most house they can get within their budget. This means you want to be the best house compared to those in your price range, rather than among the bottom compared to those in a more expensive bracket.
Key takeaway: You want to shine against your competition, not pale by comparison
Playing the Numbers
Selling a home is a numbers game: the more potential buyers, the greater chance of an offer. Overpriced homes get fewer showings, both in person and online. Your agent will tell you that showings are critical to capturing the interest of buyers, but if the home is overpriced, they will have difficulty attracting attention to your home. This can slow the entire home selling process, leaving both you and your agent feeling frustrated.
Key takeaway: More showings = more offers.
Going Stale
It’s also human nature to be drawn to what’s new, the bright, shiny object, as the saying goes. New listings attract the most attention—that’s when buyer interest is highest. The longer your home is on the market, the less appealing it becomes. And at a certain point, you may be forced to lower the price. Many buyers and their agents will assume the reason the house has been on the market so long, and why you had to lower the price, is because there is something wrong with it. Once the price drops begin, they can continue, which creates the risk of selling your home for less than what it is worth.
In addition, the longer your home is on the market, the more expenses you incur. Mortgage payments, utilities costs, and seller’s fees will continue to pile up, making it harder to recover from these costs when your home does eventually sell.
Key takeaway: Be the bright, shiny object.
Losing at the Last Minute
Let’s say you do find a buyer at the overpriced cost. During closing, the lender will order an appraisal of your home. If the appraiser finds that the market value of the home is less than the selling price, they could deny financing. If that happens and you are forced to put the house back on the market, buyers’ agents will be able to see that it’s a relisting, could assume something is wrong with the house and share those concerns with their client.
Key takeaway: Be realistic about value.
Want an accurate idea of your home’s value in the current market? I can provide you with a Competitive Market Analysis (CMA). Unlike automated home value calculators, I take into account recent market trends, unique home features, competing properties, and your home’s overall marketability.

Adapted from an article that originally appeared on the Windermere blog August 5th, 2024.
We earn the trust and loyalty of our brokers and clients by doing real estate exceptionally well. The leader in our market, we deliver client-focused service in an authentic, collaborative, and transparent manner and with the unmatched knowledge and expertise that comes from decades of experience.
© Copyright 2026, Windermere Real Estate/Mercer Island.
5 Home Design Trends for 2026

In looking ahead at interior trends for this year, it’s clear that 2026 is all about the vibes. Creating warm, genuine spaces that reflect your individual lifestyle and create a mood is much more “in” than passing fads that rely on strict aesthetic rules. Rich colors, handmade textures, and grandma-inspired patterns are infusing into rooms once prized for their understated minimalism. Here are five trends to try incorporating into your home…
Rich, Moody Colors
Warmer, nature-inspired colors continue to dominate the palette but are moving deeper and more saturated. In looking at the top colors of the year chosen by leading paint brands, earthy and nostalgic tones such as chocolate brown, burgundy, and khaki all make a prominent appearance. Moss and blue-greens also continue their popularity. On the lighter end of the spectrum, the neon pinks, blues, and greens that peaked in 2024 have now all softened into powdery pastels. Mauve is also making a comeback.
The monochromatic tonal trend is also shifting toward “atmospheric color,” where varying but closely related hues are carried across walls, furniture, and textiles to set a certain mood. It could be energetic reds and oranges for a fitness room; soothing pastels for a bedroom; or rich browns and plums for a comforting study. “Color drenching” takes it one step further by carrying a single bold shade or pattern across walls, ceilings, draperies, and trim. For inspiration, draw from the color families in Sherwin-Williams’ Colormix 2026 forecast.

“Grandmillennial” Style
Continuing on the trajectory of comforting, nostalgic interiors, this movement revives the old-school design fads that millennials fondly remember from grandma’s house. Rather than stiff, polished traditionalism, however, this new take is quirky and deeply personal. Vintage floral patterns are mixed together and layered throughout upholstery, rugs, draperies, and, pillows…perhaps with some skirted chairs, shapely wooden arms/legs, ruffles, buttons, cording, or tassels thrown in. Personal mementos and thrift store finds like mismatched antique furniture, classic art, and stained glass lighting further the lived-in feel (and are a sustainable source of style). Modern touches mixed in keep the room feeling coordinated rather than chaotic…you can also try sticking to a color family repeated throughout the room, and having a base of neutral solids.

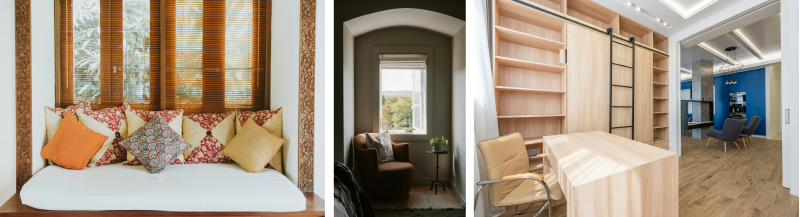
Small Moment Spaces
While the closed room layouts of the 90s have remained solidly out of style, designers are finding ways to reclaim dedicated spaces within the open layout. This can be done through niches, soft partitions like curtains, or pocket doors. Think cozy reading nooks; highly decorated “jewel box” seating niches layered with sumptuous colors and textiles; built-in desks or bookshelves at the end of the hallways; and semi-separated bedroom sitting areas reminiscent of a boutique hotel room.
The Fifth (and Sixth) Walls
Where accent walls were once all the rage, we’re now seeing accent ceilings take their place. Bold colors, hand-painted frescoes, and even wallpaper overhead add immediate interest to a room. Floors are following in their wake with bold patterned tiles or rugs adding yet another dimension of variety. Try this in a small space like a hallway, bathroom, or bedroom. Box ceilings can also make a fun canvas for accent colors. Not quite ready to take the plunge? “Color capping” is a more subtle version of this trend with colors gradually deepening toward the ceiling, which is painted a slightly darker shade of the same wall hue.

Personal Retreats
Wellness and relaxation have remained priorities for homeowners in the years following the pandemic, and now we’re seeing a rise in private sanctuaries that go beyond (or complement) the basic home gym. These can be anything from pocket size meditation rooms to spa-like recovery rooms complete with saunas and cold plunge pools. Clean, warm wood finishes and natural light are often utilized to create a biophilic sense of calm.

Curious about how to incorporate the latest home trends before you sell? Our agents see the latest home styles every day. Reach out for advice!
We earn the trust and loyalty of our brokers and clients by doing real estate exceptionally well. The leader in our market, we deliver client-focused service in an authentic, collaborative, and transparent manner and with the unmatched knowledge and expertise that comes from decades of experience.
© Copyright 2026, Windermere Real Estate/Mercer Island.


