Facebook
 X
X
 Pinterest
 Copy Link

The real estate market stayed relatively flat in the second quarter with Seattle’s year-over-year numbers holding steady and the Eastside seeing a little more of a lag. Median sales prices dipped slightly in most areas as the supply of available listings increased, but many homes still sold in the first 10 days and at or above their listed prices. The market is fairly balanced for both home buyers and sellers.
This stability feels really comforting in a market full of questions: Will my home sell? How will home shoppers respond to the price? Will they like the color of the countertops we chose? The “X Factor” for coming out on top is (and always has been) having an agent who knows the numbers…trust their spidey-senses on pricing and home prep.
For buyers, now is a prime time to dive into the market…especially if you detest the risk, bidding wars, and lack of good options we’ve seen in recent years. A word of advice to home shoppers: don’t sleep on the one that looks too good to be true. It is, and other people know it, too. Be aggressive if you want to sleep in it one day.
Click or scroll down to find your area report:
Seattle | Eastside | Mercer Island | Condos | Waterfront
SEATTLE
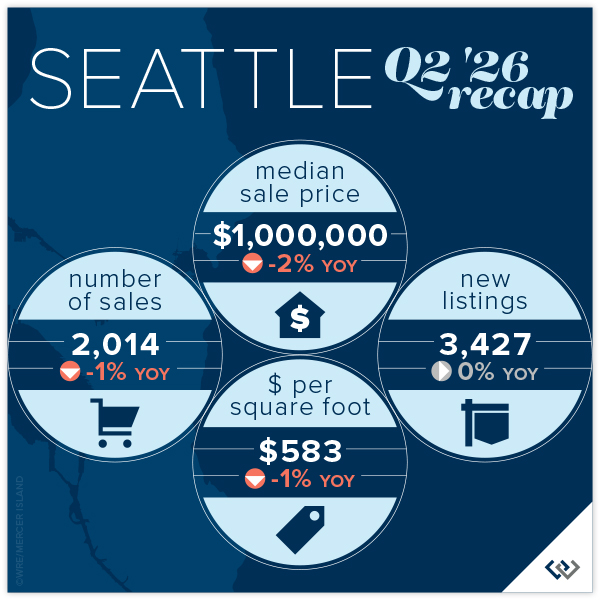
New listings hit a record high of 3,427 last quarter (or at least the 6 year high) up 0.4% YOY and sales tracked very closely behind, down just 0.6% from 2,027 in Q2 2025 to 2,014 in Q2 2026. Median home prices responded by ticking down the tiniest bit, 2% or $20,000, encouraging despite the loss.
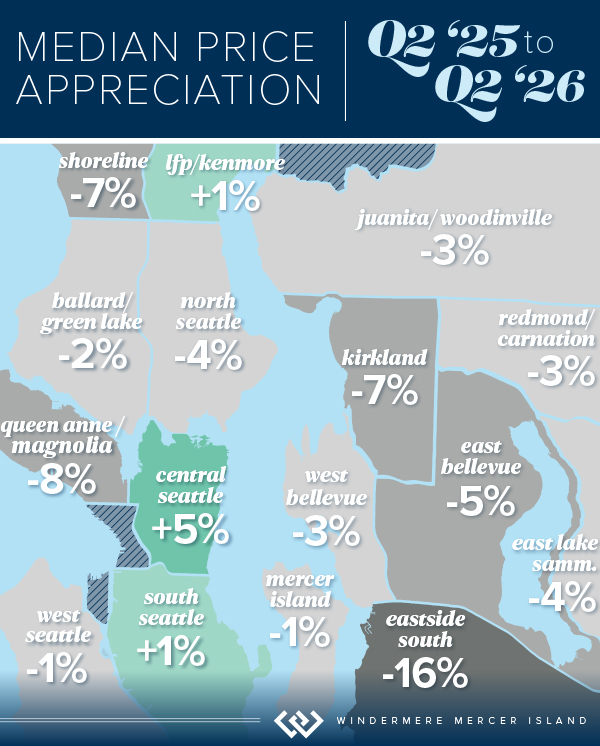
There are several bright spots on the Westside. The area South of Seattle posted a 20% gain in total sales along with a 1% rise in median price and was promptly shown up by Lake Forest Park at a 29% increase in sales also with a 1% median price lift. Capitol Hill showed the largest gain in median price at 5% (a $55,000 boost YOY). It’s nice to have a few neighborhoods to “shout out” in a YOY landscape that is relatively flat. In this case that is flat read: stable and predictable. A reprieve from the world around us.
59% of homes sold in the first 10 days and a whopping 67% of homes sold at or above list price. It’s still a good time to make a move!
Click here for the full report and neighborhood-by-neighborhood statistics!

EASTSIDE
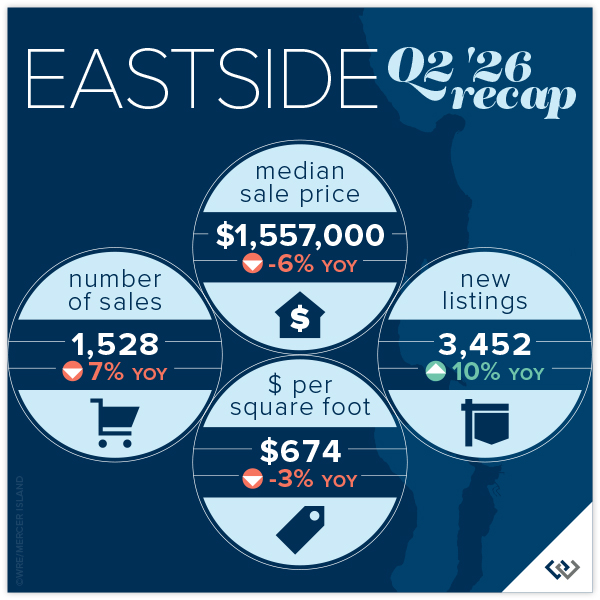
New listings hit a record high of 3,452 last quarter (or at least the 6 year high) and it appears that home shoppers were excited by the new inventory! 1,528 sales posted in Q2 of 2026. Even with this great news we are still living in a “feast or famine” era. With 3.7 months of Eastside inventory, again the highest we’ve seen in more than 6 years, it’s encouraging to see that 22% of homes sold with multiple offers. This lends statistical proof to what your agent has always told you: well prepared, strategically priced, “good” homes will be exciting in any market.
The median home price is down across the board, which makes sense given that sales are down 7% YOY and new listings are up YOY from 3,145 to 3,452 (10%). Mercer Island shows the lowest “dip” at a rounding error 1% drop in median price, while the area South of I-90 saw a 16% adjustment in the median dropping from $1,850,000 to $1,560,000.
If you’re thinking about “throwing your house in the ring,” it’s a coin toss: 51% of homes sold for at or above list and 52% of homes sold in the first 10 days. Proper pricing and preparation are key to beating those odds.
Click here for the full report and neighborhood-by-neighborhood statistics!

MERCER ISLAND
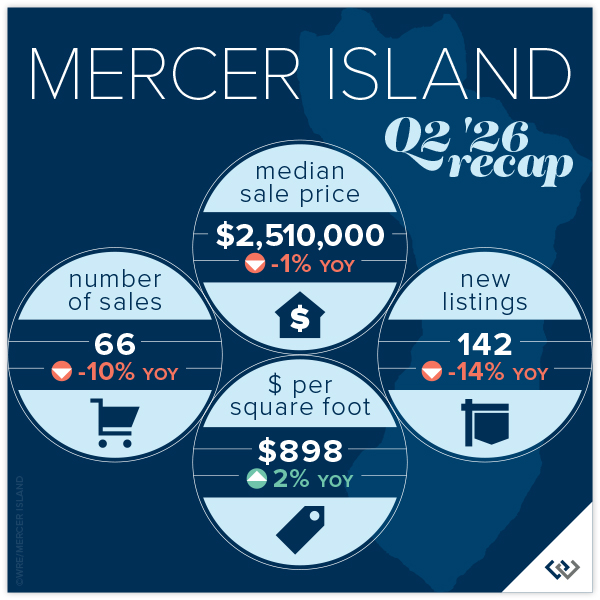
It appears that homeowners went into Q2 bullish on pricing and home shoppers did not share that value outlook; evidenced by the fact that 59% of homes sold for below asking price on Mercer Island. The median price is down during spring market for the second time in as many years, falling only 1% compared to 3% from 2024 to 2025. Moderate but still a sign that home prices are at their peak.
New listings are down 14% YOY and sales are down 10%. Even though this appears negative, we’re encouraged because of the relationship between these numbers. If new listings were up and sales were down or if sales were down less than new listings these would predict a worse outcome. You have to find a silver lining in a flat market.
With only 2 condo sales in Q2, the only conclusions we can really draw are 2 bedroom condos are the most popular product. There were 12 new listings and 9 listings at the end of the quarter which means at least one homeowner gave up. There are currently 12.9 months of condo inventory. With such little product it will only take a few sales in Q3 to drastically shift the market.
Click here for the full report and neighborhood-by-neighborhood statistics!
CONDOS – SEATTLE & EASTSIDE
The median price for Seattle condos dropped 7%, or $40,000, YOY. When you dig into the numbers this seems to be coming mostly from a 28% dip in North Seattle, which may just be from an easing in new construction condo-ized DADU listings. Across the rest of the landscape numbers are relatively flat and South Seattle posted a 9% gain!
On the Eastside there was an 11% dip in median prices led equally by Redmond, Woodinville and West Bellevue (all around 25% dips). These were balanced by more modest adjustments across the rest of the area with Mercer Island posting a 1% gain.
There is good news: 30% of condos sold in the first 10 days and 49% sold at or above list price across the region. This isn’t weighted in one direction, with relatively similar numbers posted both on the Eastside and in Seattle.
Check out area-by-area details in the full condo report.
WATERFRONT
Seattle and the Eastside both had a whopping 14 waterfront home sales in Q2, up significantly compared to Q2 of last year. Mercer Island also saw a year-over-year boost in sales from 4 to 6, while Lake Sammamish had a quieter quarter with just 5 sales compared to 13 in Q2 of 2025.
Hunts Point took the cake for highest sale with a 4.3-acre estate on over 300 feet of waterfront that went for a jaw-dropping $38 million. On the other end of the spectrum was a super cute, remodeled 1908 Rainier Beach home with 10 feet of waterfront that sold above asking price for $1,160,000.
This brief overview of the entire Seattle-Eastside private waterfront market, including Mercer Island and Lake Sammamish, illustrates the trends occurring in our region over time. This data is interesting and insightful but cannot replace an in-depth waterfront analysis with your trusted professional.
View the full waterfront report

We earn the trust and loyalty of our brokers and clients by doing real estate exceptionally well. The leader in our market, we deliver client-focused service in an authentic, collaborative, and transparent manner and with the unmatched knowledge and expertise that comes from decades of experience.
© Copyright 2026, Windermere Real Estate/Mercer Island. Information and statistics derived from Northwest Multiple Listing Service and Trendgraphix, and deemed accurate but not guaranteed.
Seattle report cover photo courtesy of Codi Nelson and Brad Crossen, HD Estates Photography.
Eastside report cover photo courtesy of Mike Ferreri and Kell Morrissey, Clarity NW Photography.
Mercer Island report cover photo courtesy of Petra Varney and Amaryllis Lockhart, Clarity NW Photography.
Condo report cover photo courtesy of Jake Kanev and FOCUSED Media Collective.